Transitional and coastal water management:
Effects of management and climate change
01 Benthic communities become more vulnerable to hypoxia with warming
Key message
Hypoxia is a mounting problem affecting the world's coastal waters, with severe consequences for marine life, including death and catastrophic changes. The deleterious effects of hypoxia are amplified by warming. Global warming will contribute to decrease the global average dissolved oxygen in the oceans worldwide, and will also affect the oxygen requirements of marine benthic macrofauna. Increasing temperature diminishes oxygen solubility and increases the respiration rates of organisms, as temperature plays a fundamental role in regulating metabolic processes. Ocean warming increases the vulnerability of benthic macrofauna to reduced oxygen, increasing the mortality of benthic fauna and greatly extending the area of coastal ecosystems affected by hypoxia-driven mortality.
Evidence
A synthesis of experimental responses of marine organisms to reduced O2 and increasing temperature shows that ocean warming increases the vulnerability of benthic macrofauna to reduced oxygen concentrations, increasing the mortality of benthic fauna and greatly extending the area of coastal ecosystems affected by hypoxia-driven mortality.
The meta-analysis (based on 576 published experiments) confirmed that survival times under hypoxia were reduced by on average 74% and that median lethal concentration increased by on average 16% when marine benthic organisms were exposed to warmer temperatures (Figure 1.1).
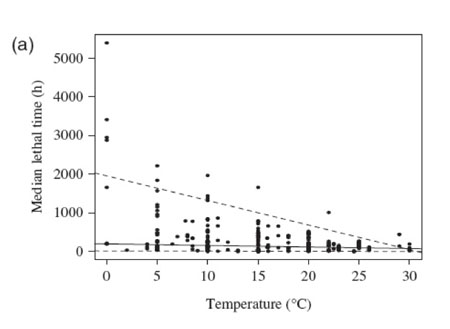 Figure 1.1a
 Figure 1.1b
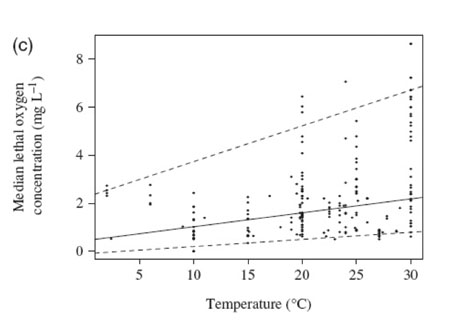 Figure 1.1c
![Figure 1.2: (a) The relationship between the median lethal time (LT50, h) and water temperature for the different experiments. The solid line represents the fitted regression for the median or the 50% quartile [LT50 (h) = 194.70 (±34.04) - 3.95 (±1.67)* temperature; N=363, P<0.03]. The dashed lines represent the fitted regression for the 95% quantile [LT50 (h)=1956.25 (±430.54)-63.62 (±19.10) * temperature; N =363, P<0.001] and the 5% quantile [LT50 (h)=12.95 (± 6.63)-0.45 (±0.31)* temperature; N=363, P=0.15].](../../img/content/5_3/figure_1_2a.jpg) Figure 1.2a
Figure 1.2a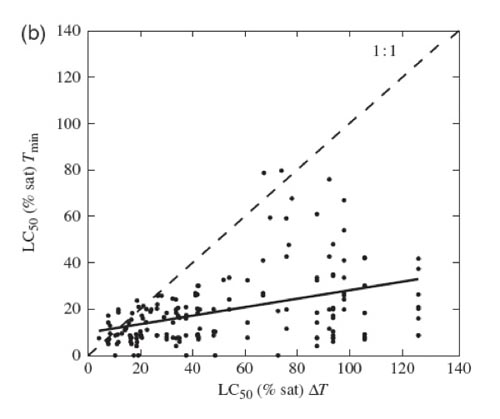 Figure 1.2b
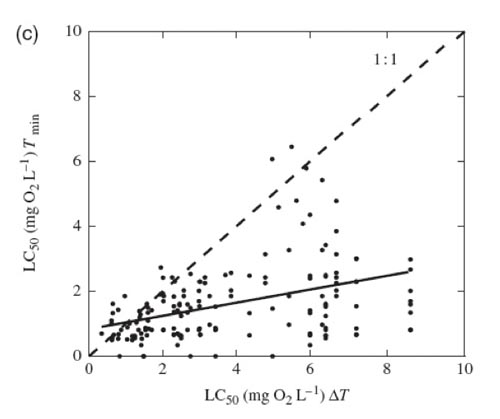 Figure 1.2c
Implication
Warming will negatively impact the survival of benthic organisms under low oxygen conditions. By the end of this century survival times will be a 35.6% lower under hypoxia and the threshold oxygen concentrations for high mortality to occur will increase by, on average, 25.5% if bottom water temperature increases by 4 ºC.
Hypoxia is already expanding globally across coastal waters, parallel to increased flux of nutrients to the coastal zone and warming of coastal waters. The synergy between two global changes, oxygen depletion and warming of coastal waters, threatens coastal benthic macrofauna. Aggravation of the negative effects of spreading hypoxia by the effect of warming in rising the O2 requirements of organisms and, therefore, the O2 thresholds for hypoxia together with the fact that warming will accelerate oxygen depletion suggest that the threats to marine biota derived from hypoxia will be amplified in a context of global warming and may, thus, be greater than hitherto anticipated.
Further reading
Detailed results can be derived from WISER deliverable 5.3-1 "Temperature effects on hypoxia and benthic fauna" as well as the paper:
Vaquer-Sunyer, R. and Duarte, C.M. (2011). Temperature effects on oxygen thresholds for hypoxia in marine benthic organisms. Global Change Biology 17:1788-1797.
02 Hydrogen sulphide exacerbates effects of hypoxia
Key message
Hypoxia is a mounting problem affecting the world’s coastal waters, with severe consequences for marine life, including death and catastrophic changes. The deleterious effects of hypoxia can be amplified by the presence of hydrogen sulphide. When the oxygen content of the waters is depleted and the oxic layer of the sediment migrates upward to the water layer, sulphide is also moved from the sediment to the water and become another stressor to benthic organisms that try to cope with hypoxia.
Evidence
A synthesis of experimental responses of marine organisms to reduced O2 and exposure to hydrogen sulphide shows that presence of hydrogen sulphide decreases survival times under hypoxia by an average of 30% in marine benthic communities (Figure 1.1). This reduction is concentration-dependent (Figure 1.2) and varies with the sulphide levels that animals experience in their natural environments. The effect of sulphide on survival is greater for eggs than for juvenile or adult stages.
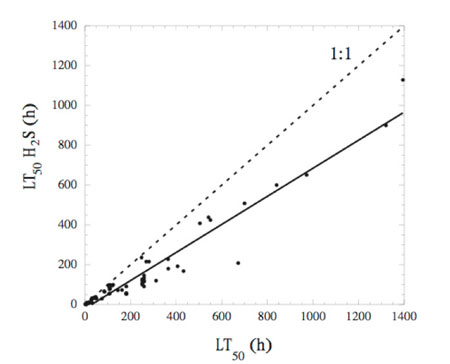 Figure 1.1
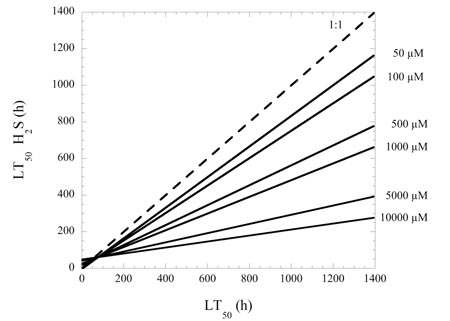 Figure 1.2
Implication
Environmental modulation of oxygen thresholds should be taken into account when formulating management strategies to protect marine biodiversity. The aggravation of the negative effects of spreading hypoxia in the presence of sulphide suggests that the threats derived from hypoxia to marine biodiversity are greater than anticipated on the basis of the direct effects of low oxygen concentration alone.
Further reading
Vaquer-Sunyer, R. and C.M. Duarte. 2010. Sulfide exposure accelerates hypoxia-driven mortality. Limnology and Oceanography 55:1075-1082.
03 Phytoplankton biomass yield relative to nutrients have doubled
Key message
Nutrient management plans in Europe and North America have apparently been unsuccessful in combating eutrophication. Many of these plans were based on relationships of increasing nutrient levels versus chlorophyll measured during the eutrophication phase, and rested on the assumption that reducing the inputs of nutrients and consequently nutrient level would similarly lead to a reduction in phytoplankton biomass. Thus, it was assumed that if nutrients were reduces to a lower level of the past then the corresponding levels of chlorophyll should also be achieved. This fundamental tenet is flawed because other pressures such as temperature increase, acidification, overfishing etc. have shifted the baselines and potentially induced a regime shift.
Evidence
The time trajectories of annual means of chlorophyll versus total nitrogen from 28 coastal ecosystems have been investigated, and 17 of these showed significant departures in time from a simple log-log relationship showing that the observed chlorophyll level gradually increased from the expected. In fact, the ratio of chlorophyll to total nitrogen has almost doubled within the last 30-40 years and this trend is consistent across most of the ecosystems analysed (Figure 1). The consistency in the trends suggests that they are the result from large-scale changes, operating at a global level and most likely associated with climate change and increased human pressures on coastal ecosystem resources.
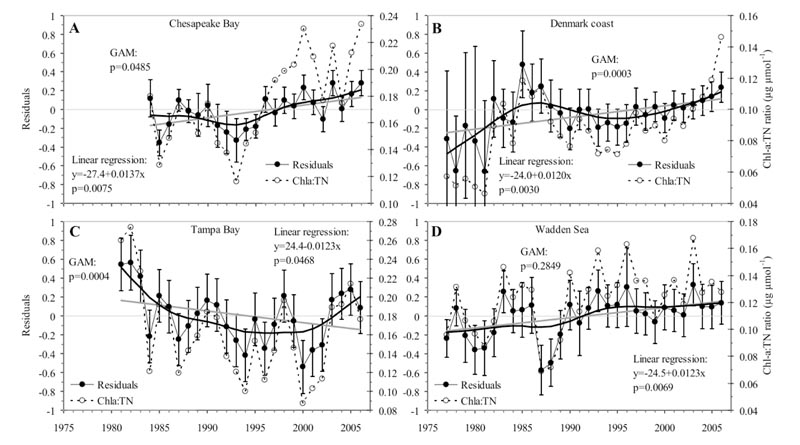 Figure 1
Implication
The fact that chlorophyll levels has not responded in a simple and predictable manner to reductions in nutrients may suggest that the approach of simple pressure-response relationship between nutrient status and ecological responses estimated from historical data is flawed. Lack of ecological recovery despite lower nutrient levels has led to frustrations amongst coastal ecosystem managers. However, it is important to stress that due to the shifting baseline caused by changes in other pressures there is a net effect from the nutrient management plans relative to the situation, if nutrients had not been reduced. Thus, nutrient management plans for recovery of coastal ecosystems must acknowledge that these systems are exposed to multiple pressures with complex interactions on all ecosystem components. Ecosystem management plans should address all the multiple pressures and tools should be developed that incorporates this complexity.
Further reading
This study has been published in WISER Deliverable D5.3-3 and as an open-access paper in Environmental Science & Technology.
Carstensen, J., Sánchez-Camacho, M., Duarte, C. M., Krause-Jensen, D., Marba, N. (2011) Connecting the dots: downscaling responses of coastal ecosystems to changing nutrient concentrations. Environmental Science & Technology 45, pp. 9122-9132. dx.doi.org/10.1021/es202351y
04 Hypoxia makes ecosystem recovery more difficult
Key message
Coastal hypoxia is increasing in the global coastal zone, where it is recognized as a major threat to biota. Hypoxia is defined as oxygen concentrations below a certain value, typically 2 ml/l or 2 mg/l, but the deleterious effects on the ecosystem already start at higher oxygen concentrations. Knowing the thresholds that fundamentally lead to a change in ecosystem functioning is important to quantify for management. Moreover, these thresholds are not static but regulated by other processes, associated with both local and global pressures on the system, particularly warming. Exceeding the critical thresholds associated with hypoxia may require even further nutrient reductions to restore a well-functioning benthic community. However, recovery from hypoxia is possible.
Evidence
The literature is populated with studies documenting decreasing oxygen concentrations associated with eutrophication, and how this affects the structure and functioning of the benthic community. Many coastal ecosystems in Europe and North America have now experienced decreasing inputs of nutrients, although the expected improvement of oxygen conditions and re-establishment of benthic fauna is only observed for a few systems, e.g. Delaware River and Stockholm Archipelago (Figure 1). In these systems the recovery took decades following drastic reductions in nutrient inputs. Many other coastal ecosystems show no signs of improvement, despite reduced levels of nutrients and chlorophyll.
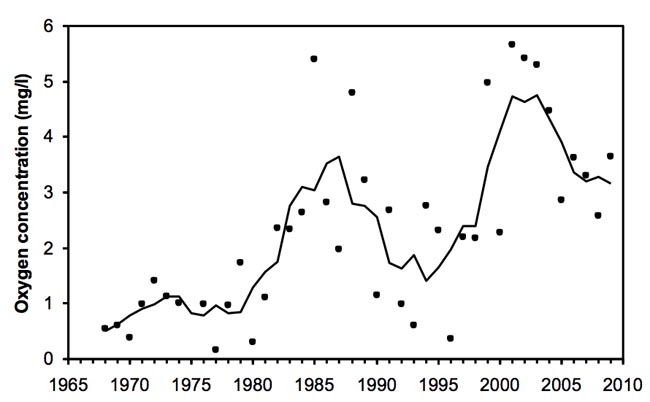 Figure 1
Implication
Hypoxia is known to alter the biogeochemical processing of nutrients leading to feed-back mechanisms through reduced nitrification and releases of iron-bound phosphorus. Moreover, the loss of bioturbating macrofaunal organisms following hypoxia reduces the efficiency of nutrient removal processes. Therefore, hypoxia is a self-sustaining process and ecosystems should be managed to maintain oxygen levels about critical thresholds that imply a collapse of the benthic community. Coastal ecosystems can, however, recover from hypoxia, but so far this has only been observed for systems with large reductions in nutrient inputs and even so, still taking decades to recover. However, re-establishment of sound benthic communities can significantly enhance the recovery process. These experiences suggest that hypoxia introduces a hysteresis response to the nutrient pressure.
Further reading
This study has been published in Environmental Research Letters.
Steckbauer, A., Duarte, C.M., Carstensen, J., Vaquer-Sunyer, R., Conley, D.J. (2011) Ecosystem impacts of hypoxia: thresholds of hypoxia and pathways to recovery. Environmental Research Letters 6:025103, doi:10.1088/1748-9326/6/2/025003.
05 Recovery of estuarine and coastal ecosystems takes decades
Key message
Anthropogenic pressures alter natural ecosystems and the ecosystems are not considered to have recovered unless secondary succession has returned the ecosystem to the pre-existing condition or state. However, depending upon the scales of time, space and intensity of anthropogenic disturbance, return along the historic trajectory of the ecosystem may: (i) follow natural restoration though secondary succession; (ii) be re-directed through ecological restoration, or (iii) be unattainable. From a review of long and medium-term monitoring networks we did, we show that although in some cases recovery can take <5 years, especially for the short-lived and high turnover biological components (i.e. plankton, meiofauna, etc.), full recovery of coastal marine and estuarine ecosystems from over a century of degradation can take a minimum of 15-25 years for attainment of the original biotic composition and diversity may lag far beyond that period (i.e. in seagrasses, hard-bottom substrata macroalgae, etc.).
Evidence
We collated 51 examples from estuaries and coasts, all around the world, and we refine the recovery from the list of stressors into six recovery mechanisms: (i) recovery from sediment modification, which includes all aspects of dredging and disposal; (ii) recovery by complete removal of stressors limiting natural ecosystem processes, which includes tidal marsh and inundation restoration; (iii) recovery by speed of organic degradation, which includes oil discharge, fish farm wastes, sewage disposal, and paper mill waste; (iv) recovery from persistent pollutants, which includes chemical discharges, such as TBT; (v) recovery from excessive biological removal, related to fisheries; and, (vi) recovery from hydrological and morphological modification. Severe impacts, whether acute, such as large oil-spills, chronic (low level inputs) or persistent over time and space (such as sewage sludge disposal, extensive wastewater discharge or mine tailings), require periods up to 10-25 years for complete recovery (Table 1). Conversely, restoration after physical disturbance (including dredging and restoration of tidal inundation) that does not leave a “legacy” stressor such as a persistent contaminant can take 1.5-10 years for recovery, although some sensitive organisms (such as angiosperms) may take over 20 years to recover (Table 1). Fish assemblages appear to recover from most pressures in less than 10 years, although it may take several decades to acquire a full species complement after starting from a state without any fish community, as was observed in the 1960s in the Thames River estuary.
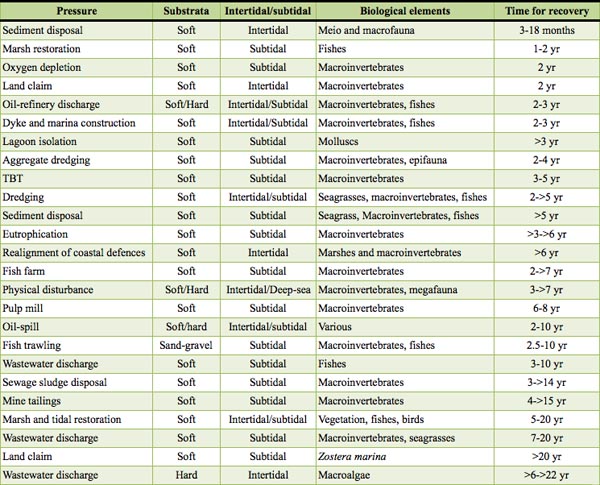 Table 1
Implication
The time for recovery, after restoration will be, in most cases, longer than the periods proposed to achieve the objectives of good ecological status (in 2015, within Water Framework Directive) or good environmental status (in 2020, within the Marine Strategy Framework Directive).
Further reading
This study has been published in Estuaries and Coasts. Borja, Á., D. Dauer, M. Elliott, C. Simenstad, 2010. Medium- and Long-term Recovery of Estuarine and Coastal Ecosystems: Patterns, Rates and Restoration Effectiveness. Estuaries and Coasts 33: 1249-1260.
06 The loss of benthic vegetation sustains a turbid regime
Key message
Seagrasses constitute an important biotope in coastal ecosystems, but there has been a global decline over the last century. This is a consequence of eutrophication stimulating growth of plankton and thereby reducing the light penetrating to the bottom. In response to this the depth limit of seagrasses, in temperate waters typically eelgrass, has decreased. Relationships linking nutrient levels with eelgrass depth limits, established on data during the eutrophication phase, have been proposed as nutrient management tools. However, such relationships are not valid for predicting the response to decreasing nutrient levels due to shifting baselines and feed-back mechanisms, where lack of benthic vegetation increases resuspension of sediments and thereby maintains a stable turbid regime.
Evidence
Nitrogen concentrations have decreased by 30-40% in many Danish estuaries following nutrient management plans addressing both point and diffuse sources. However, the decline has not been proportional across the different nitrogen fractions, and most of the decline is attributed to the dissolved inorganic fraction. The uneven reduction of the different nitrogen fractions has repercussion for the attenuation of light, which is related to the dissolved and particulate organic fractions. Moreover, resuspension of inorganic material from sediments appear to have increased over time, consistent with the decline of eelgrass, indicating that lack of eelgrass enhances resuspension of sediments (Figure 1). Thus, this suggests a possible feed-back mechanism that could lead to alternative stable states: 1) a clear state with eelgrass versus 2) a turbid state without eelgrass.
 Figure 1
Implication
Large coastal areas are now characterised by bare sediments, where eelgrass meadows used to flourish. Re-establishment of benthic habitats with eelgrass requires improved light conditions, which has not been observed in the study area yet, despite large decreases in nutrient levels. The presence of eelgrass is important since it stimulates the sedimentation of particulate matter. Eelgrass can recolonise an area in two ways: 1) vegetative colonisation and 2) seed colonisation. A turbid regime with continuous resuspension of sediments is not favourable to seed colonisation, which means that vegetative colonisation appears to be the dominant pathway for re-establishing the eelgrass meadows. Vegetative recolonisation is, however, rather slow (<0.5 m/yr) suggesting that eelgrass recovery can take decades or even longer without any other intervention.
Further reading
This study will be contributed as WISER deliverable D5.3-4 and as a contribution to the WISER special issue in Hydrobiologia).
07 Ecological regime shifts affect seagrass pressure-indicator responses and delay recovery
Key message
Ecological regime shifts affect the response of seagrass indicators to pressures and may delay restoration of seagrass meadows upon release of pressure.
Evidence
We quantified and compared benthic and pelagic gross primary production (GPP) along nutrient gradients in time and space in a shallow estuary. The estuary experienced a shift from a pristine, seagrass-dominated clear water regime with high total GPP in the early 20th century to a eutrophic, plankton-dominated regime still with high total GPP in the 1980s when nutrient loadings peaked. Recent reductions in nutrient loadings reduced pelagic GPP as expected, but the water remained unclear and seagrass abundance and GPP did not increase correspondingly. The results suggest that feedback mechanisms, such as increased resuspension of the seafloor and reduced trapping of particles and nutrients, resulting from the loss seagrasses and their associated ecosystem services delay or prevent restoration to a state with seagrass dominance.
Implication
Ecosystems do not necessarily respond linearly to changes in nutrient loadings and that the response to eutrophication and oligotrophication may follow different trajectories. Reductions in nutrient loadings to levels below those causing the decline in seagrasses may be necessary, along with initiatives to e.g. reduce the disturbance of the seafloor, in order to stimulate a return to a seagrass-dominated state.
Further reading
This study was included in WISER deliverable D4.2-2 and published in Estuaries and coasts.
Krause-Jensen D, Markager S, Dalsgaard T (2011) Benthic and pelagic primary production in different nutrient regimes. Estuaries and coasts. DOI 10.1007/s12237-011-9443-1