Integration of different Biological Quality Elements / Management across water categories
01 The 'one-out all-out' principle for combining multiple BQEs into an integrated classification must be applied with caution
Key message
Although the WFD requires the use of the 'one-out all-out' rule in classifying the biological status of a water body, its strict application is not always recommended because of the risk of downgrading sites too easily. The 'one-out all-out' rule works best if the redundancy between BQEs is as low as possible.
Evidence
The 'one-out all-out' (OOAO) is the required principle by the WFD, classifying the biological status of a water body on the basis of the biological quality element (BQE) with the worst class score (Classification guidance, 2003). This rule is very precautionary, based on the assumption that different BQEs respond to pressures in different ways and that there is a need to protect the most vulnerable biological group. However, its strict application is not always recommended because there is a risk of downgrading sites too easily.
In WISER's WP6.2 this was demonstrated using monitoring data sets and modelled data. Monitoring datasets from Swedish lakes assessed with up to four BQEs (phytoplankton, macroinvertebrates, macrophytes, fish) and Austrian rivers with two BQEs (macroinvertebrates and fish) were used to demonstrate the effect of different combination rules on classification outcome. In all cases, the OAOO rule gave the highest probability of classifying water bodies in moderate or worse status compared to using the average or median (Figure 1). Uncertainty in estimates of ecological status class for water bodies was calculated using the software WISERBUGS (Clarke 2010, Software section).
Simulations with artificial data demonstrated that, when combining multiple BQEs that are sensitive to the same pressures or combination of pressures, the OOAO rule produced unbiased results and good class agreement only when metrics had a low level of uncertainty (SD <=0.01), which in practice is very difficult to achieve. The reliability of the classification was already very sensitive at a moderate level of metric uncertainty (SD >0.05) (Figure 2A). An alternative rule tested for combining the same set of BQEs was the average rule, producing better results for high uncertainty metrics (Figure 2B). However this is not in accordance with the WFD guidance, as averaging among BQEs is not recommended.
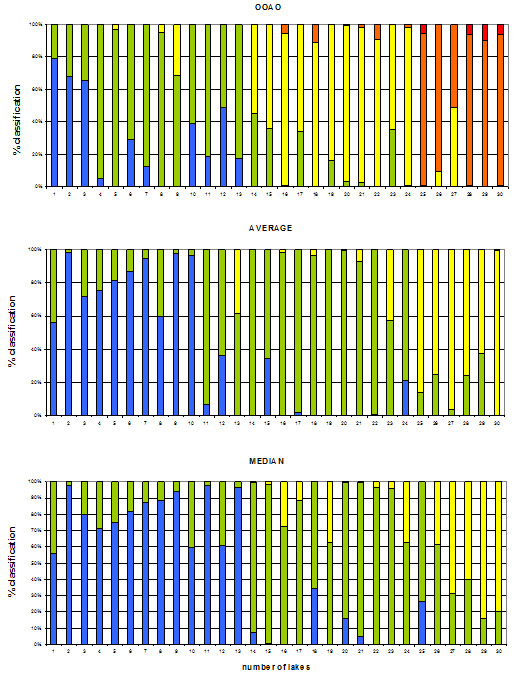 Figure 1
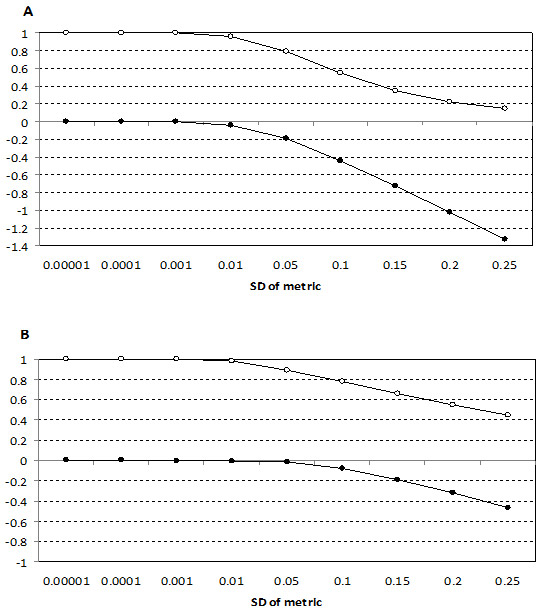 Figure 2
Implication
The uncritical application of the 'one-out all-out' (OOAO) principle could pose the danger of downgrading status class of water bodies too easily. In particular, water managers should be careful when multiple BQEs that are redundant for detecting the same pressure, or combination of pressures, need to be combined into a water body assessment. It has been demonstrated that the OOAO approach only gives acceptable and comparable results if the different BQEs are complementary, showing the effects of different pressures, on different temporal and/or spatial scales, on different aspects of ecosystem functioning. Also the level of uncertainty in the biological metrics and in the BQEs used in the assessment should not be too high and not too different between BQEs.
Further reading
Alahuhta, J., K-M., Vuori, S., Hellsten, M., Järvinen, M., Olin, M.Rask, and A., Palomäki, 2009. Defining the ecological status of small forest lakes using multiple biological quality elements and paleolimnological analysis. Fundamental and Applied Limnology, Archiv für Hydrobiology 175/3: 203-216.
Borja, A., & J.G. Rodriguez, 2010. Problems associated with the 'one-out, all-out' principle, when using multiple ecosystems components in assessing the ecological status of marine waters. Marine Pollution Bulletin 60: 1143-1146.
Clarke, R., 2010 WISERBUGS (WISER Bioassessment Uncertainty Guidance Software). http://www.wiser.eu
Hering, D., Borja, A., Cartensen, J. Carvalho, L., Elliott, M., Feld, C., Heiskanen, A-S., Johnson, R., Moe, J, Pont, D., Solheim, A. L., van de Bund, W., 2010. The European Water Framework Directive at the age of 10: A critical review of the achievements with recommendations for the future. Science of the Total Environment. 408:4007-4019.
Moss, B., et al., 2003. The determination of ecological status in shallow lakes - a tested System (ECOFRAME) for the implementation of the European Water Framework Directive. Aquatic conservation: Marine Freshwater Ecosystems. 13: 507-549.
Rask, M., K.M., Vuori, H., Hämäläinen, M., Järvinen, S., Hellsten, H., Mykrä, L.,Arvola, J., Ruuhijärvi, J., Jyväsjärvi, I., Kolari, M., Olin, E., Salonen, and P., Valkeajärvi, 2011. Ecological classification of large lakes in Finland: comparison of classification approaches using multiple quality elements. Hydrobiologia, 660: 37-47.
02 Restoration can only become successful when all pressures are tackled simultaneously
Key message
Aquatic ecosystems are often simultaneously affected by multiple pressures, so consequently restoration must address these stressors simultaneously in order to be successful. For example, both the decrease in pH and increase in ammonium concentrations are associated with acid deposition. Phosphorus and nitrogen concentrations usually increase as a result of fertiliser run-off and the reduction of current speed coupled with an increase in siltation rate are associated with river canalisation. However, pressures are often water category specific. In general, rivers integrate the adverse effects of various human activities and associated pressures within a catchment, with hydromorphological degradation predominating, lake ecosystems are mainly affected by eutrophication and shoreline modification (at the global scale) and acidification (at the regional scale), while estuaries and coastal waters comprise the ultimate sink for nutrients, contaminants and other sources of pollution originating from entire river basins and are being physically.
Evidence
In most restoration projects measures are taken to reduce the primary stressor, but secondary stressors often confound recovery in lakes (see Figure 1). Confounding factors such as water quality, with particular emphasis on nutrient enrichment, large-scale hydrological change such as floods and droughts and catchment management/land use and multiple pressures cause delays or failures in aquatic system recovery.
Recovery has not necessarily failed, but the presence of secondary pressures may have pushed response times beyond those over which monitoring is typically performed. Acidification, fisheries management, industrial pollution, non-native species and climate change were the main secondary pressures impacting de-eutrophication projects in aquatic systems. Especially, internal P loading slows down recovery in many eutrophied lakes.
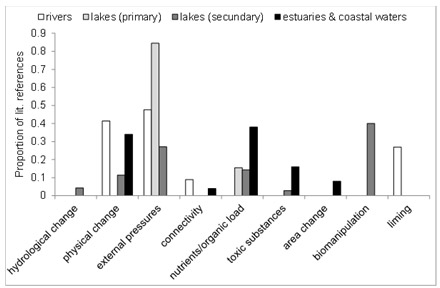 Figure 1
Implication
Recovery depends on the type and magnitude of the pressures, especially if some are still present, and on the organism group(s) used to assess recovery. Delays in recovery can be attributed to several factors, and different water types are exposed to different combinations of pressures resulting in differences in response times.
What restoration ecology more in general, needs is:
- Definition of clear goals for restoration at catchment scale that are based on recent biological monitoring results and the actual distribution of targeted species or communities.
- Identification of best-practice restoration measures to address the specific pressures.
- Balancing all measures within a catchment in order to reach the best possible synergy effects of single component measures, and ultimately to achieve recovery of the entire catchment.
Further reading
Borja, A., Dauer, D.M., Elliott, M. and Simenstad, C.A. 2010. Medium- and long-term recovery of estuarine and coastal ecosystems: patterns, rates and restoration effectiveness. Estuaries and Coasts 33: 1249-1260.
Feld, C.K., Birk, S., Bradley, D.C., Hering, D., Marzin, A., Melcher, A., Nemitz, D., Pedersen, M.L., Pont, D., Verdonschot, P.F.M., Friberg, N., Natural, F., Feld, C.K., Birk, S., Bradley, D.C., Hering, D., Kail, J., Marzin, A., Pletterbauer, F. & Pont, D. (2011) From natural to degraded rivers and back again : a test of restoration ecology theory and practice. Advances in Ecological Research, 44, 119-209.
Søndergaard, M., Jeppesen, E., Lauridsen,T.L., Skov, C., Van Nes, E.H., Roijackers, R., Lammens, E. and Portielje, R. 2007. Lake restoration: successes, failures and long-term effects. Journal of Applied Ecology 44: 1095-1105.
Jowett, I.G., Richardson, J. and Boubée, J.A. 2009. Effects of riparian manipulation on stream communities in small streams: Two case studies. New Zealand Journal of Marine and Freshwater Research 43: 763-774.
Spears, B, Gunn, I., Meis, S. and May, L. 2011. Analysis of cause-effect-recovery chains for lakes recovering from eutrophication. CEH-report. Contribution to Deliverable D6.4-2.
03 Recovery needs time, long time
Evidence
Long-term studies of recovery in rivers, lakes and estuarine and coastal waters are scarce. One important question before comparing time spans of recovery between water categories is the definition of 'full recovery'. 'Full recovery' refers to an optimal functioning of the aquatic ecosystem under the given environmental circumstances that are not or only slightly changed by human activity. Literature for both riverine and marine systems addresses this issue (see Table 1 for marine examples), while for many lakes in lowland areas focus is more on a shift from turbid to clear water states. Monitoring for a large proportion of studies was < 5 to 10 years, and only a few studies (one each) in rivers and estuarine and coastal waters extended >20 years (Figure 1).
Large discrepancies exist between the length of monitoring programmes and the time needed for the ecosystem to reach 'full recovery'. Although most studies do not address 'full recovery', some estimates are available. Recovery after weir removal may take as long as 80 years. Recovery after riparian buffer instalment may take at least 30-40 years. In lakes, time for recovery from eutrophication varies from 10-20 years for macroinvertebrates, 2 to >40 years for macrophytes, 2 to >10 years for fish. Natural recovery from acidification takes much longer compared to recovery after liming, and like eutrophication, biological recovery is taxon specific and often decades are needed to achieve pre-disturbed conditions. Estuarine and coastal waters have long periods of recovery (>10 years), although macroinvertebrates have the potential to recover within months to <5 years though mostly take >6 years. Fish recover within one to three years, depending on the type and intensity of pressure. In general, after intense and large pressures, periods of 15-25 years for attainment of the original biotic composition, diversity and complete functioning may be needed in all three water categories.
In both rivers and lakes the success rate of restoration measures appears to be much higher for the abiotic conditions than for the biotic indicators, this is particular true for hydromorphological restoration and liming. Since eutrophication is considered also to be an important pressure in rivers and lakes, this might be a major cause of hampering recovery. In lakes internal nutrient loading often delays recovery. For rivers the response of macroinvertebrates to hydromorphological restoration is questionable; some studies have shown recovery while other studies do not possibility due to the still too high nutrient levels.
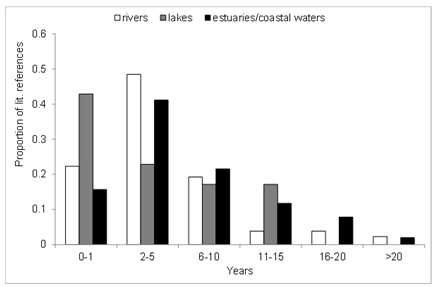 Figure 1
 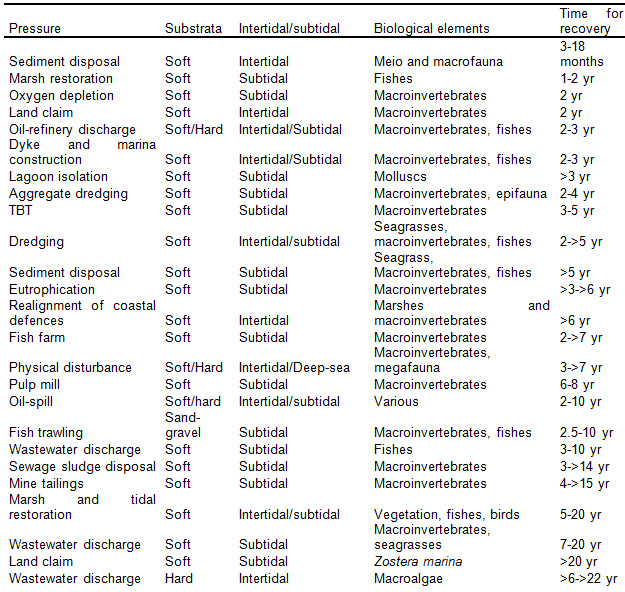 Table 1
Implication
Only from monitoring of biological and environmental changes after restoration can new knowledge on recovery processes can be gained and implemented. Indeed, this information provides the opportunity for practitioners and scientists to evaluate the success and efficacy of the restoration measures. Restoration monitoring requires a tailor-made sampling design (preferably a BACI-design) that allows of sound statistical analysis according to state-of-the-art methods. Surprisingly, the BACI design is primarily applied to experimental studies. A Before-After-Control-Impact (BACI) monitoring design is considered the best approach for monitoring recovery, as only this approach is capable of detecting actual effects of restoration from other natural effects, such as seasonal or annual variability.
Further reading
Bernhardt, E.S., Palmer, M.A., Allan, J.D., Alexander, G., Barnas, K., Brooks, S., Carr, J., Clayton, S., Dahm, C., Follstad-Shah, J., Galat, D., Gloss, S., Goodwin, P., Hart, D., Hassett, B., Jenkinson, R., Katz, S., Kondolf, G.M., Lake, P.S., Lave, R., Meyer, J.L., O'Donnell, T.K., Pagano, L., Powell, B. and Sudduth, E. 2005. Synthesizing U.S. River Restoration Efforts. Science 308: 636-637.
Bernhardt, E.S., Palmer, M.A., Allan, J.D., Alexander, G., Barnas, K., Brooks, S., Carr, J., Clayton, S., Dahm, C., Follstad-Shah, J., Galat, D., Gloss, S., Goodwin, P., Hart, D., Hassett, B., Jenkinson, R., Katz, S., Kondolf, G.M., Lake, P.S., Lave, R., Meyer, J.L., O'Donnell, T.K., Pagano, L., Powell, B. and Sudduth, E. 2005. Synthesizing U.S. River Restoration Efforts. Science 308: 636-637.
Gray, J.S. and Elliott M. 2009. Ecology of Marine Sediments: science to management. OUP, Oxford, 260 pp.
Reitberger, B., Matthews, J. , Feld, C.K., Davis, W. and Palmer, M.A. 2010. River monitoring and indication of restoration success: comparison of EU and BCG frameworks. University of Duisburg-Essen, Essen, 154 pp.
Smith, E.P., Orvos, D.R., and Cairns, J. 1993. Impact assessment using the before-after-control-impact model: concerns and comments. Can. J. Fish. Aquat. Sci. 50: 627-637.
04 Monitoring of restoration needs a before-after-control-impact design to learn by doing
Key message
Monitoring of restoration needs a before-after-control-impact (BACI) design to learn by doing. This BACI approach allows for a sound analysis of the effects of restoration, as it i) compares the conditions before and afterwards (BA) and relates the identified changes to potential natural changes at restored and unrestored control sites (CI). Hence, the BACI approach allows of a separation of restoration effects from natural variability.
Evidence
Despite the wealth of monitoring programmes focused on rehabilitating lotic systems, most studies are designed for local situations and address single pressures. For example, Bernhardt et al. (2005) stated that of 37 000 river restoration projects in the United States, only 10% included some form of monitoring, and the authors argued that the information was often inadequate to evaluate successes and failures. Similarly, an overview of 16 European papers on river restoration studied by Reitberger et al. (2010) showed that none of the studies, for example, analysed time series of restoration monitoring. Hence, these two reviews emphasize the need for high quality data to properly evaluate the efficacy of restoration effort and to make generalisations and improvement, which might increase the frequency of successes. Poor availability of data can be due to several reasons. First, an overwhelming majority of restoration measures have not included monitoring, probably because there is no legal requirement. Second, when restoration measures are monitored, the methods and time-scales applied are often inadequate considering knowledge of recovery time lags. Third, most water authorities do not focus on long term ecological processes, but focus instead on getting the job done, with little or no interest in properly evaluating the results.
Restoration monitoring usually, at best, follows a Before-After sampling design (Figure 1). Long-term time series data, commonly available for lakes are usually lacking for rivers and even less so for marine systems. For lakes, monitoring programmes typically do not encompass the pre-impact period, both for eutrophication and acidification.
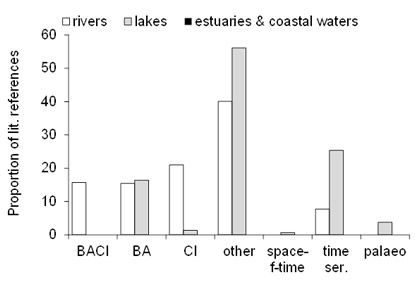 Figure 1
Implication
The time lags of recovery after removal of the stressor(s) are highly variable in all three water categories, from months to many decades. Recovery depends on the type and magnitude of the stressor(s), especially if some are still present, and on the organism group(s) used to assess recovery. Delays in recovery can be attributed to several factors, and different water types are exposed to different combinations of stressors resulting in differences in response times. Furthermore, there needs to be agreement upon the restoration goals for the system and also what criteria will be used to determine attainment of the desired or targeted system. For example, from the outset it should be stated whether a system is being restored merely for its abiotic features, its structural elements, i.e. the appropriate species, or full functioning.
Further reading
Bernhardt, E.S., Palmer, M.A., Allan, J.D., Alexander, G., Barnas, K., Brooks, S., Carr, J., Clayton, S., Dahm, C., Follstad-Shah, J., Galat, D., Gloss, S., Goodwin, P., Hart, D., Hassett, B., Jenkinson, R., Katz, S., Kondolf, G.M., Lake, P.S., Lave, R., Meyer, J.L., O'Donnell, T.K., Pagano, L., Powell, B. and Sudduth, E. 2005. Synthesizing U.S. River Restoration Efforts. Science 308: 636-637.
Feld, C.K., Birk, S., Bradley, D.C., Hering, D., Marzin, A., Melcher, A., Nemitz, D., Pedersen, M.L., Pont, D., Verdonschot, P.F.M., Friberg, N., Natural, F., Feld, C.K., Birk, S., Bradley, D.C., Hering, D., Kail, J., Marzin, A., Pletterbauer, F. & Pont, D. (2011) From natural to degraded rivers and back again : a test of restoration ecology theory and practice. Advances in Ecological Research, 44, 119-209.
Simenstad, C., Reed, D., and Ford, M. 2006. When is restoration not?: Incorporating landscape-scale processes to restore self-sustaining ecosystems in coastal wetland restoration. Ecological Engineering 26: 27-39.